US Bonds and Oil Prices: Why we should care about what’s happening in the Middle East.
- Govies-Simran and Akanksha
- Jan 18, 2018
- 4 min read
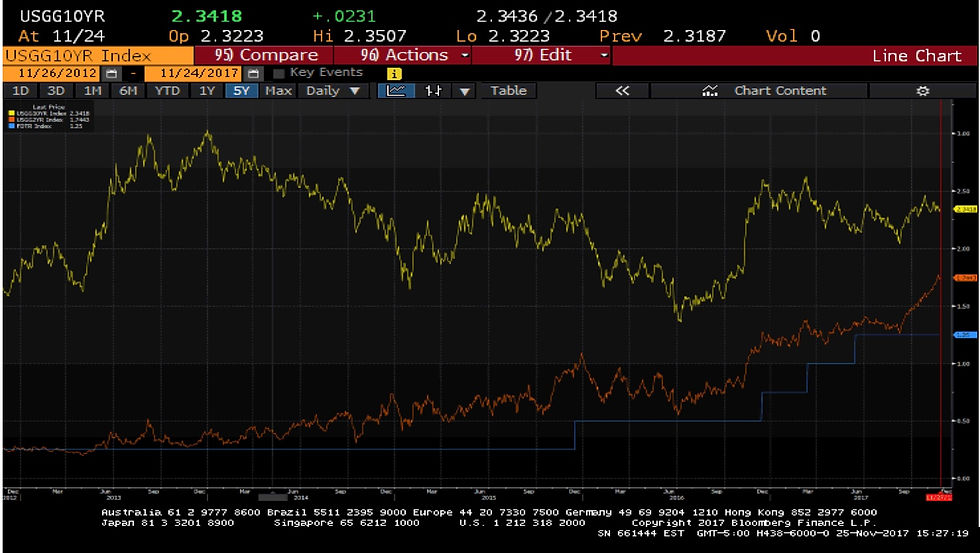
On the 1st of November, the US Treasury’s announcement to maintain its issuance of 10-year government coupon debt at their current level of $23bn coincided with the yield spread between 2- and 10-year treasury bonds hitting its lowest level in 10 years, marking a flattening of the yield curve. The steepness of the yield curve has often been used as an indicator of a possible future recession.

This is because the yield curve spread contains expectations on future inflation and interest rates, which positively correlate with the future economic performance of that economy. Hence, flatter the yield curve, the greater the risk of recession. Given this development in the US treasury bond yields, it becomes imperative for investors to understand the potential short and long-term driving factors of US bond prices, and how this may influence their investment decisions going ahead.
Perhaps much of the short-term movements in the yield curve can be explained through the FED’s consistent rate hikes over the past year. As Fed officials firmly stick to their plan in 2017, earning the trust of bond traders, short-end yields, which are more sensitive to Fed policy expectations, have gradually been rising. However, long-term yields have remained pretty much stagnant. This may be as a result of persistently low inflation and Treasury’s recent announcement to focus on increasing the supply of shorter-dated coupon maturities, like two- and five-year notes, while the Federal Reserve continues to taper reinvestment of its balance sheet. Eventually, bond investors are faced with a relative scarcity at the long-end of the yield curve alongside an additional boost in yield at the short-end to account for the increased supply.

However, in order to create a bigger picture, we must look beyond the scope of domestic monetary policy. The path of US bond yields may also be driven by political and global factors beyond the FED’s control. Something that we’ve highlighted is the intriguing relationship between oil prices and US bond yields.
Currently, due to the supply offered by US shale oil producers being around a breakeven rate of $47 a barrel, oil prices are forecasted to hover around the $50 a barrel level for the next 12 months. The resistance level is estimated to be around $57 a barrel. However, we cannot overlook the current situation regarding the demand-side of the oil market. No, we are not talking about President Trump’s visit to the Korean peninsula. The political risk spotlight is now beaming on Middle Eastern tensions, as oil prices begin to edge upwards.
Oil prices have always been heavily influenced by geopolitical factors, and the Middle East is currently going through a lot of political turmoil. Tensions between Saudi Arabia and Iran have been escalating, with Lebanon being caught in the crossfire. The recent firing of a missile from Yemen at Riyadh has had the Saudis blaming Iran and putting pressure on Lebanon’s Prime Minister - Saad Hariri - to resign. Compounding these incidents is the current anti-corruption drive by the Saudi Crown Prince, where a number of prominent officials and even members of the royal family have been detained. Whether or not the Crown Prince’s actions are rooted in a genuine interest in reducing corruption, the uncertainty has had an adverse effect on oil prices.
Such political tensions could potentially cause oil prices to break through the resistance level. In the unlikely scenario where we see oil prices remain higher over a longer time period, the role of petrodollars in the US and EM bond markets becomes an intriguing topic of discussion!
When prices rise, more USD flow into these emerging oil exporting countries. The money is used in two ways; productive long-term investments and savings. But where has this money been saved? $1.2 trillion has gone into risk-free assets such as FX reserves. However, this is a miniscule sum compared to the estimated $13 trillion of total external assets explained by sovereign wealth funds. The rest of the money is used in non-transparent investment activity. Looking at the transparent investment activity, $350 billion of the $1.2 trillion of FX reserves (25%) is invested in US treasuries. If we extrapolate and extend this 25% to hidden Sovereign Wealth Funds then there is a further $3.5 trillion held in US treasuries by these oil exporting countries. This totals to an astonishing 20% of total US outstanding debt!
All of this amounts to a large impact on the price of US treasuries. To sum it up, the higher the price of oil, the greater the number of US treasuries bought, leading to higher prices and lower yields.
At the moment events in the Middle East are current and still unfolding, so it will be important to stay aware of the latest activities. Furthermore, oil prices are not necessarily the singular influence on US treasury yields, yet there is strong evidence of an inverse correlation between the two. Evidence strong enough to not disregard. <Graph 3>
In the short term, due to potential volatility in the markets, we advise the ‘Barbell Strategy’ with regards to investment portfolios. In the flattening yield curve environment, if investing in the US 10-year notes, it is advisable to also invest in short-term bonds, perhaps an US 2-year note. This provides flexibility in making changes to movements in the bond market. Investors should further be aware that developments in the Middle East could potentially fuel an upward pressure on oil prices and hence have an impact on US Treasury bond yields. Therefore, in the long-term we recommend holding onto this bond whilst observing both domestic and foreign signals.


